Reporting & analytics
Know what is happening across your portfolio.
The dashboard consolidates operational and financial indicators into one view, and the report library turns the same data into documents your team can share.
Capabilities
What you can do
- 01
Executive dashboard
Portfolio value, occupancy, contracted rent, collection, compliance health, outstanding rent and a portfolio health score on one screen.
- 02
30 / 60 / 90-day action list
Overdue rent, compliance deadlines, hearings, expiring certificates and lease renewals, ranked by urgency.
- 03
Ten standard reports
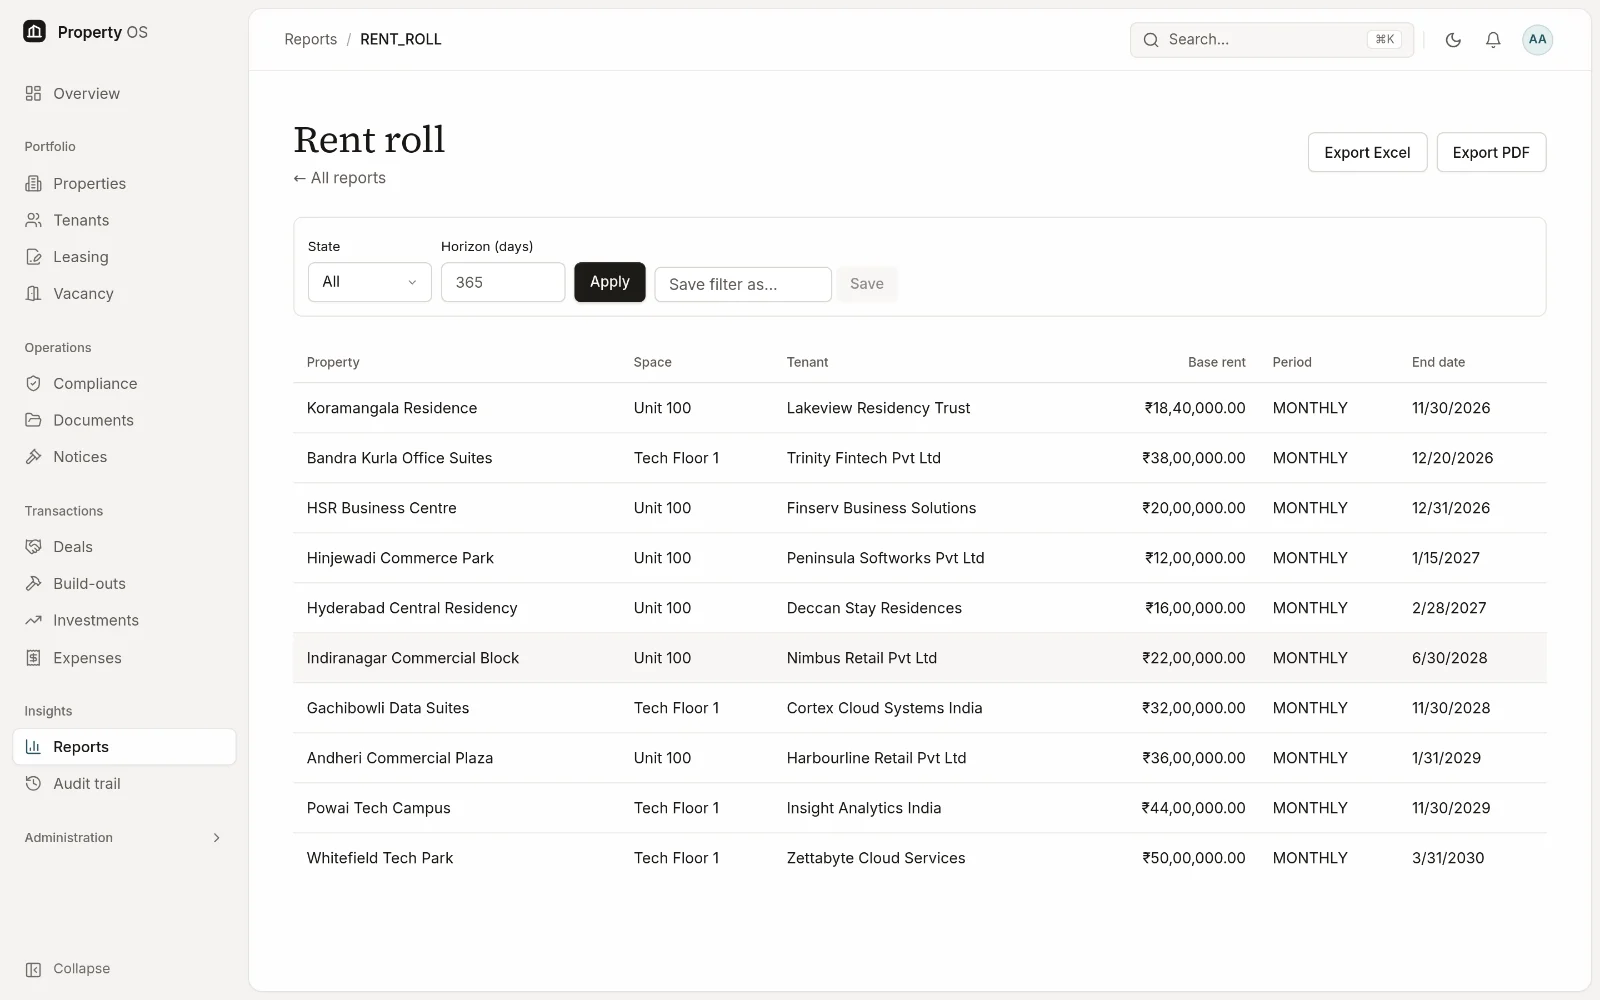
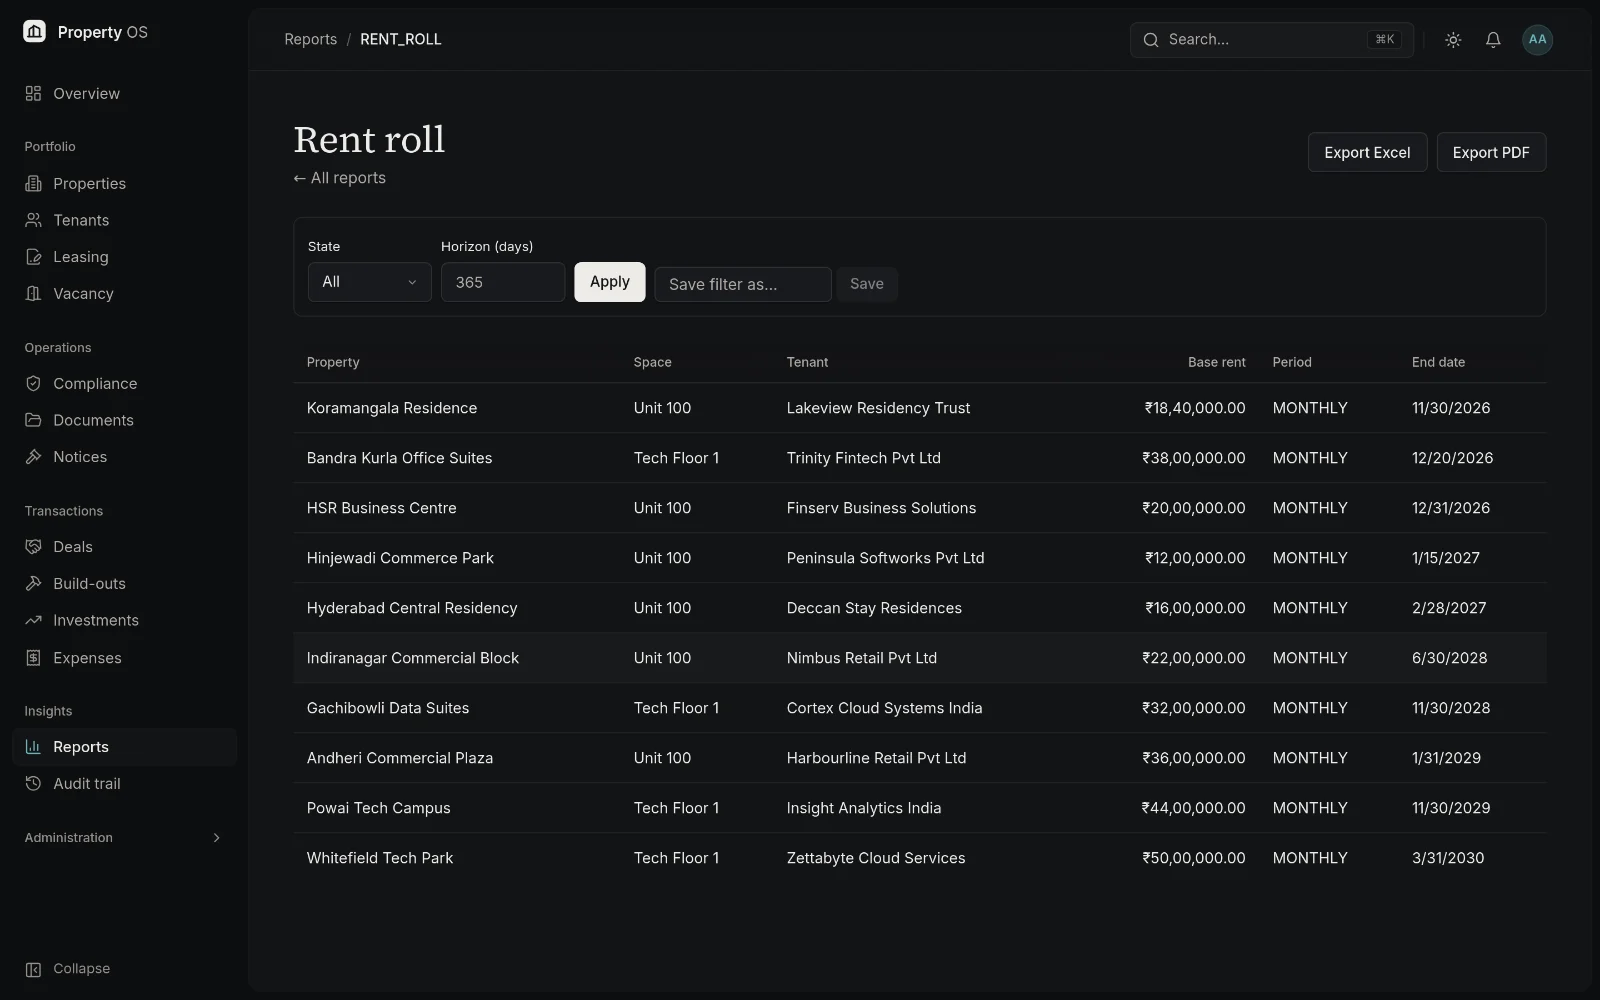
Rent roll, arrears ageing, vacancy, lease expiry, compliance status, property status, valuation summary, transaction register, build-out budget vs actual and missing documents.
- 04
Excel and PDF export
Every report exports to Excel and PDF for board packs, lenders and auditors.
- 05
Saved filters
Save the filters you use on lists and reports and return to them in one click.
- 06
Scheduled reports
Have reports sent weekly or monthly to the people who need them.
Typical workflow
How teams use it
Open the dashboard
See portfolio health and what needs attention today.
Drill in
Follow an indicator into the properties, leases or obligations behind it.
Report
Run a standard report with your saved filters.
Share
Export to Excel or PDF, or schedule it for regular delivery.
Why it matters
Business benefits
One view for leadership
Operational and financial indicators in the same place.
Less report assembly
Standard reports replace manually compiled spreadsheets.
Consistent numbers
Every report draws on the same live records.
Bring your property portfolio into focus.
See how Property OS can bring your property data, operational workflows and reporting into one connected platform.